
3/21/18 — by Alasdair Philips, Denis L. Henshaw, Graham Lamburn, and Michael O’Carroll; Original paper here.
ABSTRACT
Objective
To investigate detailed trends in malignant brain tumor incidence over a recent time period.
Methods
UK Office of National Statistics (ONS) data covering 81,135 ICD10 C71 brain tumors diagnosed in England (1995–2015) were used to calculate incidence rates (ASR) per 100k person–years, age–standardised to the European Standard Population (ESP–2013).
Results
We report a sustained and highly statistically significant ASR rise in glioblastoma multiforme (GBM) across all ages. The ASR for GBM more than doubled from 2.4 to 5.0, with annual case numbers rising from 983 to 2531. Overall, this rise is mostly hidden in the overall data by a reduced incidence of lower grade tumors.
Conclusions
The rise is of importance for clinical resources and brain tumor etiology. The rise cannot be fully accounted for by promotion of lower–grade tumors, random chance or improvement in diagnostic techniques as it affects specific areas of the brain and only one type of brain tumor. Despite the large variation in case numbers by age, the percentage rise is similar across the age groups which suggests widespread environmental or lifestyle factors may be responsible.
HIGHLIGHTS
- A clear description of the changing pattern in incidence of brain tumor types
- The study used extensive data from an official and recognized quality source
- The study included histological and morphological information
- The study identified a significant and concerning incidence time trend
- Some evidence is provided to help guide future research into causal mechanism


INTRODUCTION
The causes of brain tumors in adults remain largely unknown1. In 2011 the World Health Organization (WHO) prioritized the monitoring of detailed brain tumor incidence trends through population–based cancer registries2. This paper reports recent changes in malignant brain tumor incidence in England that includes age, sex, morphology and tumor location.
MATERIALS and METHODS
Data
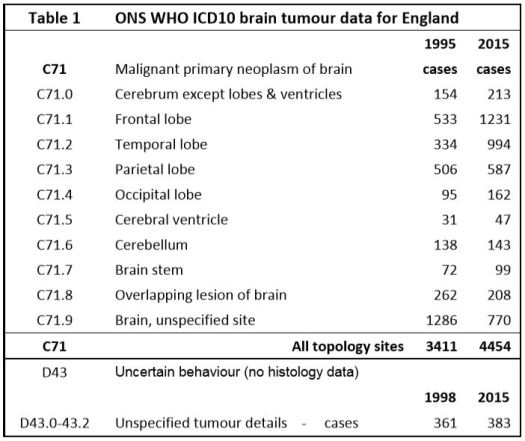
The International Classification of Diseases for Oncology (ICD–O) is a dual classification, with coding systems for both topography and morphology3. The relevant topology codes are listed in Table 1, along with the number of tumors diagnosed in 1995 and 2015. There are 102 different ICD–O–3.1 morphology codes used in the data set, though many have few cases. The morphology code describes the cell type and its biological activity / tumor behaviour. WHO last updated their classifications in 2016 but their changes have minimal impact on our analysis of the data4 Malignant5. brain neoplasms without histology are recorded as ICD–10 D43 (D43.0 & D43.2 supratentorial).
We used anonymised individual–level national cancer registration case data from the UK Office of National Statistics (ONS) for all 81,135 ICD10–C71 category primary malignant brain tumors diagnosed in England for the years from 1995 to 2015, plus 8,008 ICD10–D43 supratentorial malignant tumors without histology/morphology data from 1998–2015. The initial data is supplied by the National Cancer Registration Service (NCRS). The ONS then apply further validation checks and the UK Department of Health use the ONS data to inform policy making. The ONS state their cancer data are generally within 2% of the correct values6. Until about 2005 some cases in the oldest age–groups will not have been recorded in the cancer registries. Since 2005 this error is likely to be small.
Glioblastoma Multiforme (GBM), the most common and most malignant primary tumor of the brain, is associated with one of the worst five–year survival rates among all human cancers, with an average survival from diagnosis of only about 1 year. This ensures that few cases will be unrecorded in the ONS database and we show that their number of GBM tumors is similar to NHS hospital inpatient numbers. The data include the year of diagnosis, age at diagnosis, sex of patient, primary site and morphology code. National population estimates of age and gender by calendar year were also obtained from ONS data7 and age–specific incidence rates per 100,000 person–years and for a wide variety of tumor types were calculated in 5 year age group bins for males and females separately.
Some published incidence analyses have used different criteria as to which glioma and astrocytoma should be considered malignant. WHO considers Grades I to IV as biologically malignant even if they have not been graded histologically malignant. We have taken the WHO/IARC morphology behaviour codes /3, /6 and /9 as being histologically malignant which means that Grade I and II tumors are classed as low–grade malignancies.
We are not aware of any specific bias in the ONS data. There is a slight data–lag in cancer registry data which are regularly checked and updated if necessary but are generally stable after 3 to 5 years. Our ONS data extract is dated 4th July 2017.
Brodbelt et al (2015)8] reported an analysis of treatment and survival for 10,743 GBM cases in England over the period 2007–2011 which had an overall median survival of only 6·1 months, rising to 14·9 months with maximal treatment. Brodbelt’s GBM case total from English hospital data is only 0.5% higher that our ONS GBM total of 10,687 cases for the same time–period; this suggests that a very complete UK cancer diagnosis and registration system is now in place. In contrast, Ostrom et al (2015)9 reporting on USA SEER brain tumor data provide a scatter–plot that shows a median complete registration and histological confirmation level of only about 65%, with the best examples returning less than 75% full completion in 2012.
Confounding
We had a large number of categories and sub–categories in the data. It was necessary to combine some of these to increase the resolving power. We ran analyses separately for each site (C71.0 to C71.9), for each main type of tumor, and for tumor grade (I to IV). It was immediately obvious that the most significant change was in the incidence of GBM in frontal and temporal lobes. The obvious potential confounders would be the C71.8 (overlapping) and C71.9 (unspecified) categories due to better imaging techniques and we discuss this later.
Standardization
Incidence rates rise dramatically with age and standardization is necessary as population age–profiles are changing with time. We calculated age–standardized incidence rates (ASR) per 100k person–years to the current recommended European Standard Population (ESP–2013), as it best represents the reality of the case burden on society10. Adjusting European cancer incidence to the World Standard Population is not helpful as the age-spectra are so different.
Table 2 lists the morphology codes with the highest case numbers totaling 80,354 tumors. Included in our analyses are an additional 781 cases in 78 other categories, each with fewer than 100 cases over the 21 years. A full listing of all the cases in the data set is provided in the Supplementary File [S1].

We needed to group data to improve resolution and reduce random data noise. We examined infant and child neoplasms separately but did not find any statistically significant time–trends. Three age-groups seemed reasonable. We chose a child, teenage and young-adult group (0-29), a main middle-age group (30-54) and an older age group (over 55 years of age). These reasonably split the population into three roughly equal (20, 18 and 16 million) groups of people. The case totals in the three groups were about 9.5k, 19.5k and 52k respectively. We tested moving the cut point boundaries by 5 years in both directions and it made little difference to the overall results.
Analysis
The cases were analysed by morphology, topology, sex, age, age–specific and age–standardised incidence. The Annual Average Percentage Change (AAPC) and corresponding 95% CI and p–values were calculated using Stata SE12.1 (StataCorp). A linear model on the log of the age–standardised rates which tests for a constant rate of change (e(ln(rate))) best fitted the data. See Supplementary File sections [S2] and [S3]
Background
In a major 2013 Review paper, Hiroko Ohgaki and Paul Kleihues11 wrote “Glioblastoma is the most frequent and malignant brain tumor. The vast majority of glioblastomas (~90%) develop rapidly de novo in elderly patients, without clinical or histologic evidence of a less malignant precursor lesion (primary glioblastomas). Secondary glioblastomas progress from low-grade diffuse astrocytoma or anaplastic astrocytoma. They manifest in younger patients, have a lesser degree of necrosis, are preferentially located in the frontal lobe, and carry a significantly better prognosis.”
Overall primary malignant brain tumor ASRs are only rising slowly and are often considered fairly static. Figure 1 shows the age–standardised trends from 1971 to 2015. From the 1970s to about 2000 there was a fairly steady rise in recorded overall incidence rate, however since then the rise has slowed, though clinicians have been reporting a rise in high-grade, aggressive, tumors.

Overall adult survival for all malignant brain tumors after diagnosis during 2006–2010 was about 35% for one year and 15% for five years, falling to about 3% for aggressive grades–III and IV tumors. ONS data show age-standardised death rates from malignant brain tumors (C71) have increased by 7% between 2001 and 2015, showing that improvements in treatment alone are inadequate and that there is a need to find ways of preventing brain cancer12.
RESULTS
Comparing new case numbers in 2015 with 1995 shows an extra 1548 aggressive GBM tumor cases annually. Figure 2 and Table 3 show that up to about 2004 the overall rise in GBM incidence (Annual Average Percentage Change (AAPC) 5.2%, 95% CI 3.7–6.6, p < 0·00003) could be mostly compensated for by the fall in incidence of all lower grade astrocytoma and “glioma, malignant, NOS, ICD10–93803”. This leaves a fairly steady rise in the GBM ASR from 2004 to 2015 (AAPC 2.2%, 95% CI 1.4–3.0, p < 0·0001).
between 1995 and 2015, analysed by type and year (Data in Table 3). Grouping details
(1) = 94403 ̶ 94433; (2) = 93843, 94003 ̶94303; (3) = 93803; (4) = 93813, 93823, 93903 ̶ 93943, 94503 ̶ 9473
Ohgaki and Kleihues [11] reported that most secondary GBMs are found in younger middle age people and most primary GBMs are in over 60s. We tested our (30 ̶ 54) and (>54) age group data, splitting the total GBM into de-novo and promoted tumors. We estimated the maximum possible number of promoted tumors using the change in the grades II and III diffuse and anaplastic astrocytomas. The results are shown in Figures 3 & 4. These are discussed later.

promoted GBMs is based on incidence change of Grades II and III diffuse and anaplastic astrocytoma.
We found a large decrease of ASR over time for Grade–II diffuse astrocytoma, a slight rise in ASR for WHO Grade–III anaplastic astrocytoma (94013; 2832 cases). There was little change in rates of anaplastic oligodendroglioma (94513; 1339 cases), anaplastic ependymoma (93923; 313 cases) Grade–II oligodendroglioma (94503; 2671cases), embryonal, or ependymal tumors.
Figure 5 shows the relative increase in age-specific GBM incidence between the averaged periods (1995–1999) and (2011–2015) for 5–year age–groups. This 1.5-fold change is remarkably similar across the age–groups, suggesting a universal factor.

1995-1999 and 2011-2015 in 5-year age-bands and gender


Figure 6 shows ASR GBM rates for frontal lobe, temporal lobe, unspecified & overlapping (C71.8 & C71.9) and ‘all other brain regions’. Most of the rise is in the frontal and temporal lobes, and most of the cases are in people over 55 years of age, with a highly statistically significant overall AAPC of 7.6% (see Table 4). There was an extra rise in frontal and temporal GBM incidence between 2006 and 2008 which coincided with a slight reduction in the GBM ASR in overlapping and unspecified regions and may be due to improved imaging.
DISCUSSION
Using sufficiently high–quality data, we present a clearer picture of the changing pattern in incidence of brain tumor types than any previously published. We report a sustained and highly statistically significant ASR rise in GBM across all ages and throughout the 21 years (1995–2015), which is of importance both for clinical resources and brain tumor etiology.
Dobes et al (2011)13 reported a significant increase in malignant tumor incidence from 2000 to 2008 in the ≥65–year age group. In a second paper they noted an increasing incidence of GBM (APC, 3·0; 95% CI, 0·5–5·6) in patients in the same age group, especially in temporal and frontal lobes14. de Vocht et al (2011)15 reported a rise in temporal lobe tumor incidence in ONS data but dismissed its significance. In a 2016 paper he claimed no increase in GBM incidence, but later published a major correction to the paper that shows an increase16.
Zada et al (2012)17 using USA SEER data for 1992–2006 reported a rising trend in frontal and temporal lobe tumors, the majority of which were GBM, with a decreased incidence of tumors across all other anatomical sub–sites. Ho et al (2014)18 reported a 2.2–fold increase in glioblastoma incidence in the Netherlands over the period 1989–2010 (APC 3.1, p<0.001).
There were no material classification changes over the analysis period that might explain our findings19, though multidisciplinary team working was strengthened (2005 onwards) and better imaging has resulted in improved diagnosis along with a more complete registration of brain tumors in the elderly. We analysed our data into 5 year age group categories to look for evidence of improved diagnosis; the data do suggest diagnosis and registration have improved in people aged over 70. However at earlier ages the incidence rate of ‘all’ glioma (and all C71) registrations have remained almost constant, whereas the rates for lower–grade tumors fell until about 2006 and have since remained fairly static as the rate for GBM has risen steadily.
Most GBM cases seem to originate without any known genetic predisposition. GBMs from promoted lower–grade gliomas usually have different molecular genetic markers from de novo GBMs20. The 2016 revision of the WHO classification of CNS tumors [3, 4] highlights the need for recording molecular genetic markers and divides glioblastomas into two main groups. The IDH–wildtype mostly corresponds to clinically defined primary or de novo glioblastoma and account for about 90% of cases. The remaining 10% are IDH–mutant cases which usually arise in younger patients and mostly correspond to secondary or promoted lower–grade diffuse glioma [11, 21]. Figures 3 and 4 support Ohgaki and Kleihues21 conclusion that promoted (secondary) tumors mainly occur in younger people and that de novo GBMs dominate in the over-54 age group. It is important that this pattern is monitored using modern genetic techniques.
GBM tumors are almost always fatal and are not likely to have been undiagnosed in the time frame of our data. It is possible that some elderly cases were not fully classified, but then they should have been recorded as ICD10–D43. However as D43 rates have remained very constant over this time period (see Figure 1) this is unlikely to have been a significant confounder.
Possible causal factors
We cite examples of some possible causal factors that have been discussed in the literature that could contribute changes in GBM incidence. In an important 2014 “state of science” review of glioma epidemiology, Ostrom et al 22 list and discuss a number of potential factors that have been associated with glioma incidence, some of which we list below.
Ionising radiation, especially from X-rays used in CT scans, has the most supportive evidence as a causal factor. Due to the easy availability of CT imaging and relative lack and higher cost of MRI imaging in UK NHS hospitals, CT scans are often used especially for initial investigations. Their use over the period 1995-2013 is shown in the Supplementary File [S6]. Given the time frame of the trend that we have identified, we suggest that CT imaging X-ray exposures should be further investigated for both the promotion and initiation of the rising incidence of GBM tumors that we have identified.
Preston et al (2007)23 concluded that radiation–associated cancer persists throughout life regardless of age at exposure and that glioma incidence shows a statistically significant dose response. Our oldest age group also experienced atmospheric atomic bomb testing fallout and some association with ingested and inhaled radionuclides should not be dismissed as a possible factor. England was in one of the highest exposed regions for atmospheric testing fallout as determined by the United Nations Scientific Committee on the Effects of Atomic Radiation, UNSCEAR 2000 Report24. Further information is given in Supplementary File S7. If only some of the population were susceptible and received a significant dose, any resulting extra cancers would show up in the ONS data.
The European Study of Cohorts for Air Pollution Effects by Andersen et al (2017)25 found suggestive evidence of an association between traffic-related air pollution and malignant brain tumors.
There is increasing evidence literature that many cancers including glioma have a metabolic driver due to mitochondrial dysfunction resulting in downstream26 genetic changes27 in the nucleus28.
The International Agency for Research on Cancer (IARC) judged both power–frequency ELF (2002) 29 and radio–frequency RF (2011)30 electromagnetic fields as Group 2B ‘possible human carcinogens’. Villeneuve (2002)31 concluded that occupational (ELF) magnetic field exposure increases the risk of GBM with an OR = 5.36 (95% CI: 1.2 – 24.8).
Hardell and Carlberg (2015)32 have reported an increase in high–grade glioma associated with mobile phone use. The multi-country Interphone study33 collected data from 2000 to 2003 and included few people over 55 years of age and would have been unable to resolve any association involving older–aged people. Volkow et al (2011)34 found that, in healthy participants and compared with no exposure, a 50-minute cell phone exposure produced a statistically significant increase in brain glucose metabolism in the orbitofrontal cortex and temporal pole regions closest to the handset.
CONCLUSIONS
-
We show a linear, large and highly statistically significant increase in primary GBM tumors over 21 years from 1995–2015, especially in frontal and temporal lobes of the brain. This has aetiological and resource implications.
-
Although most of the cases are in the group over 54 years of age, the age–standardised AAPC rise is strongly statistically significant in all our three main analysis age groups.
-
The rise in age–standardised incidence cannot be fully accounted for by improved diagnosis as it affects specific areas of the brain and just one type of brain tumor which is generally fatal. We suggest that widespread environmental or lifestyle factors may be responsible.
-
Our results highlight an urgent need for funding more research into the initiation and promotion of GBM tumors. This should include the use of CT imaging for diagnosis and also modern lifestyle factors that may affect tumor metabolism.
Acknowledgements
We are very grateful to Professor Geoffrey Pilkington and Professor Annie Sasco for their invaluable comments on early drafts of this paper. We thank the ONS for providing the data and Dr Michael Carlberg for advice regarding statistical analysis
LEGENDS
Figure 1 – Age–standardised overall trends from 1971 to 2015 using data in ONS MB1 series, including a smaller number of supratentorial neoplasms without histology or morphology data coded D43.0 & D43.2 . The data table for this figure is in the SI file as [S4].
Figure 2 – Age–standardised incidence rates for all C71 glioma cases diagnosed between 1995 and 2015 analysed by type and year (Data in Table 3). Grouping details: (1) = 94403 ̶ 94433 (2) = 93843, 94003 ̶94303 (3) = 93803 (4) = 93813, 93823, 93903 ̶ 93943, 94503 ̶ 94733
Figures 3 and 4 – Age–standardised rates for two age groups. The possible split between de novo and secondary promoted GBMs is based on incidence change of Grades II and III diffuse and anaplastic astrocytoma.
Figure 5 – Relative change in GBM age–specific incidence rates (ASpR) averaged over two fiveyear periods 1995-1999 and 2011-2015 in 5-year age-bands and gender
Figure 6 – Frontal and temporal lobe GBM age–standardised incidence rates by tumor site and year (data table in the SI as [S6])
Supplementary File Contents
S1. Data morphology coding and case numbers table
S2. Database options and screenshot
S3. Sample STATA data and DO script
S4. Data-table for Figure 1
S5. Data-table for Figure 6
S6. CT and MRI use in the UK NHS
S7. Ionising radiation in the environment from man-made sources
Data Sharing
The data were obtained from the UK Office for National Statistics (ONS) who are the legal owners of the data. Some data are publicly available in the ONS annual MB1 data series which are freely downloadable from the ONS website, but this paper uses the latest updated data, plus ICD–O–3 morphology codes, extracted under personal researcher contract from the ONS database in September 2015. ONS Data Guardian approval was required for the supply, control and use of the data. A nominal charge is made by the ONS for such data extraction. We are not permitted to supply the raw ONS extracted data to anyone else. Other researchers can obtain the latest data directly from the ONS in a similar manner.
The authors provide some extra tables and figures in the Supplementary File downloadable from the journal website.
CONTRIBUTORSHIP STATEMENT
AP and GL conceived the study and first–drafted most of the manuscript with significant input from DLH and MJOC. GL organised the data obtained from the UK ONS and wrote the database analysis scripts. All authors had full access to the results of all analyses and have provided strategic input over several years of following the ONS brain tumor data. All authors have approved the final manuscript. AP is the guarantor for the ONS data.
Competing Interests Statements
DLH, MJOC and GL declare: no support from any organisation for the submitted work; no financial relationships with any organisations that might have an interest in the submitted work in the previous three years; no other relationships or activities that could appear to have influenced the submitted work. AP is a Trustee of Children with Cancer UK, a large UK Charity. AP, a professional engineer, on a voluntary unpaid basis, has run Powerwatch (a small UK NGO) for the last 25 years. Powerwatch provides free public information on possible health associations with EMF exposure. AP is Technical Director of EMFields Solutions Ltd who design and sell measuring instruments and he is a shareholder of Sensory Perspective Ltd. AP declares that these nor any other financial or related interests have influenced him in co–authoring the submitted work.
Funding
This research received no grant from any funding agency in the public, commercial or not–for– profit sectors. The ONS data extracts were paid for personally by AP.
REFERENCES
-
M. L. Bondy, M. E. Scheurer, B. Malmer, et al., “Brain Tumor Epidemiology: Consensus From the Brain Tumor Epidemiology Consortium,” CANCER, vol. 113, no. 7 Suppl, pp. 1953–68, 2008. doi:10.1002/cncr.23741 ↩
-
E. van Deventer, E. van Rongen, R. Saunders, “WHO research agenda for radiofrequency fields,” Bioelectromagnetics, vol. 32, no. 5, pp. 417–421, 2011. doi:10.1002/bem.20660. [Online First 2011 Mar 14] ↩
-
IARC – International Classification of Diseases of Oncology – ICD-O-3 online: http://codes.iarc.fr/abouticdo.php ↩
-
D. N. Louis, A. Perry, G. Reifenberger , et al., « The 2016 World Health Organization Classification of Tumors of the Central Nervous System: a summary,” Acta Neuropathologica, vol. 131, no. 6, pp. 803–820, 2016. doi: 10.1007/s00401016-1545-1 ↩
-
D. N. Louis, H. Ohgaki, O. D. Wiestler , et al., “WHO Classification of Tumours of the Central Nervous System. 4th Ed (rev),” IARC, ISBN–10 9283244923, 2016. ↩
-
UK Office for National Statistics, “Cancer Statistics: Registrations Series MB1,” https://www.ons.gov.uk/peoplepopulationandcommunity/healthandsocialcare/conditionsanddiseases/bulletins/cancerregistrationstatisticsengland/2015#data-quality Accessed 6th November 2017. ↩
-
UK Office for National Statistics, “Population Estimates for UK, England and Wales, Scotland and Northern Ireland,” https://www.ons.gov.uk/peoplepopulationandcommunity/populationandmigration/populationestimates Accessed 6th November 2017. ↩
-
A. Brodbelt, D. Greenberg, T. Winters, et al., “Glioblastoma in England: 2007–2011,” Eur. J. Cancer, vol. 51, pp. 533– 542, 2015. doi: 10.1016/j.ejca.2014.12.014. [Online First 2015 Feb 3] ↩
-
Q. T. Ostrom, H. Gittleman, J. Fulop, et al., “CBTRUS Statistical Report: Primary Brain and Central Nervous System Tumors Diagnosed in the United States in 2008-2012,” Neuro Oncol., vol. 17, Suppl. 4, pp. 1-62, Oct 2015. doi: 10.1093/neuonc/nov189. [First Online 2015 Oct 27] ↩
-
European Union, “European Standard Population,” ISSN 1977–0375, 2013. Accessed 6th November 2017 http://ec.europa.eu/eurostat/en/web/products-manuals-and-guidelines/-/KS-RA-13-028 ↩
-
H. Ohgaki, P. Kleihues, “The definition of primary and secondary glioblastoma,” Clin Cancer Res,vol. 19, pp. 764–772, 2013. doi:10.1158/1078-0432.CCR-12-3002. [Online First 2012 Dec 3] plus letter and response 2014. ↩
-
UK Office for National Statistics, “<1971–1994 8290769_tcm77–395904.xls>” downloaded from the ONS, 26th September, and for 1995–2013 data, Table 13 in <https://www.ons.gov.uk/file?uri=/peoplepopulationandcommunity/healthandsocialcare/conditionsanddiseases/datasets/can cerregistrationstatisticscancerregistrationstatisticsengland/2015/cancerregistrations2015final22.05.2017.xls> downloaded from the ONS, 10th July 2017. ↩
-
M. Dobes, V. G. Khurana, B. Shadbolt, et al., “Increasing incidence of glioblastoma multiforme and meningioma, and decreasing incidence of Schwannoma (2000–2008): Findings of a multicenter Australian study,” Surg Neurol Int., vol. 2, no. 176, pp. 1–7, 2011. doi:10.4103/2152-7806.90696. [Online First 2011 Dec 13] ↩
-
M. Dobes, B. Shadbolt, V. G. Khurana, “A multicenter study of primary brain tumor incidence in Australia (2000–2008),” Neuro–Oncology, vol. 13, no. 7, pp. 783–790, 2011. doi:10.1093/neuonc/nor052. ↩
-
F. de Vocht, I. Burstyn, J. W. Cherrie, “Time trends (1998–2007) in brain cancer incidence rates in relation to mobile phone use in England,” Bioelectromagnetics, vol. 32, pp. 334-9, 2011. doi:10.1002/bem.20648. [Online First 2011 Jan 28] ↩
-
F. de Vocht 2016 paper corrigendum, http://www.sciencedirect.com/science/article/pii/S0160412017301241?via%3Dihub ↩
-
G. Zada, A. E. Bond, Y–P Wang, et al., “Incidence Trends in the Anatomic Location of Primary Malignant Brain Tumors in the United States: 1992–2006,” World Neurosurg., vol. 77, no. 3/4, pp. 518–524, 2012. doi:10.1016/j.wneu.2011.05.051. [Online First 2011 Nov 7] ↩
-
V. K. Y. Ho, J. C. Reijneveld, R. H. Enting , et al., “Changing incidence and improved survival of gliomas,” European Journal of Cancer, vol 50, pp 2309–2318, 2014. doi:10.1016/j.ejca.2014.05.019. [Online First 2014 Jun 24] ↩
-
http://systems.hscic.gov.uk/data/clinicalcoding/codingadvice/ toolbox Accessed 5th October 2015 ↩
-
G. P. Dunn, M. L. Rinne, J. Wykosky, et al., “Emerging insights into the molecular and cellular basis of glioblastoma,” Genes & Development, vol. 26, pp. 756–784, 2012. doi:10.1101/gad.187922.112. ↩
-
H. Ohgaki, P. Kleihues, “Genetic alterations and signalling pathways in the evolution of gliomas,” Cancer Sci, vol. 100, no. 12, pp. 2235–41, 2009. doi:10.1111/j.1349-7006.2009.01308.x. [Online First 2009 Aug 6] ↩
-
QT Ostrom, L Bauchet, FG Davis, et al., “The epidemiology of glioma in adults – a ‘state of the science’ review,” NeuroOncology, vol. 16 no.7, pp. 896–913, 2014 ↩
-
D. L. Preston, E. Ron, S. Tokuoka, et al., “Solid cancer incidence in atomic bomb survivors:1958–1998,” Radiat Res, vol. 168, no. 1, pp. 1–64, July 2007. ↩
-
United Nations Scientific Committee on the Effects of Atomic Radiation, UNSCEAR 2000 Report. ↩
-
ZJ Andersen, M Pedersen, G Weinmayr, et al., “Long-term exposure to ambient air pollution and incidence of brain tumor: the European Study of Cohorts for Air Pollution Effects” (ESCAPE), Neuro-Oncology 20(3), 420–432, 2017. doi:10.1093/neuonc/nox163 ↩
-
T. N. Seyfried, “Cancer as a mitochondrial metabolic disease,” Front Cell Dev Biology, vol. 3, p. 43, 2015. doi:10.3389/fcell.2015.00043. eCollection 2015. ↩
-
M. G. Abdelwahab, K. E. Fenton, M. C. Preul, et al., “The ketogenic diet is an effective adjuvant to radiation therapy for the treatment of malignant glioma,” PLoS ONE, vol. 7, no. 5, e36197, 2012.. doi:10.1371/journal.pone.0036197. [First Online 2012 May 1] ↩
-
T. N. Seyfried, R. E. Flores, A. M. Poff, et al., “Cancer as a metabolic disease: implications for novel therapeutics,” Carcinogenesis, vol. 35, no. 3, pp. 515–27, 2014. doi:10.1093/carcin/bgt480. [First Online 2013 Dec 16] ↩
-
IARC, “Monographs on the Evaluation of Carcinogenic Risks to Humans, Non–Ionizing Radiation, Part 1: Static and Extremely Low–Frequency (ELF) Electric and Magnetic Fields,” Volume 80, 2002. ↩
-
IARC, “Monographs on the Evaluation of Carcinogenic Risks to Humans, Non–Ionizing Radiation, Part 2: Radiofrequency Electromagnetic Fields,” Volume 102, 2013. ↩
-
P. J. Villeneuve, D. A. Agnew, K. C. Johnson, et al., “Brain cancer and occupational exposure to magnetic fields among men: results from a Canadian population–based case–control study,” Int J Epi, vol. 31, pp. 210–217, 2002. ↩
-
L. Hardell and M. Carlberg, “Mobile phone and cordless phone use and the risk for glioma – Analysis of pooled case–control studies in Sweden, 1997–2003 and 2007–2009,” Pathophysiology, vol. 22, no. 1, pp. 1–13, 2015. doi:10.1016/j.pathophys.2014.10.001. [Online First 2014 Oct 29] ↩
-
C. Wild, “IARC Report to the Union for International Cancer Control (UICC) on the Interphone Study,” WHO, IARC, Lyon, 03 October 2011. ↩
-
N. D. Volkow, D. Tomasi, G. J. Wang, et al., “Effects of Cell Phone Radiofrequency Signal Exposure on Brain Glucose Metabolism,” JAMA, vol. 305, no. 8, pp. 808–813, 2011. doi:10.1001/jama.2011.186 ↩
You must be logged in to post a comment.